Here we go. This is hypothetical, of course.
1st District: Jack Kingston (R)
Image may be NSFW.
Clik here to view.
Image may be NSFW.
Clik here to view.
Statistics (from 2008): R+20, 70% White, 23% Black
This district takes up much of Republican South Georgia. It's very rural, with Valdosta and some of the Savannah Suburbs as its only real population centers. It does use water contiguity; if that is not allowed then it can have a strip along the coast. The Democratic average is only 39%, so don't think about a Blue Dog picking this seat up; this part of Georgia turned red by 1994.
2nd District: Sanford Bishop (D)
Image may be NSFW.
Clik here to view.
Image may be NSFW.
Clik here to view.
Statistics: D+8, 50% Black, 41% White
I made this a VRA district, but excluded Macon and instead stretched it into Clayton County. Major changes from the old map are losing 8 conservative South Georgia counties and 2 conservative Central Georgia ones, while picking up the conservative parts of Columbus, Meriwether County, a bit of La Grange, and the arm to Clayton County.
3rd District: Lynn Westmoreland (R)
Image may be NSFW.
Clik here to view.
Image may be NSFW.
Clik here to view.
Statistics: R+25. 79% White, 13% Black
This district combines parts of Westmoreland's old district with parts of Gingrey's to make a major vote sink. The county with the lowest PVI here is R+20.
4th District: Hank Johnson (D-Guam)
Image may be NSFW.
Clik here to view.
Image may be NSFW.
Clik here to view.
Statistics: D+11, 52% Black, 39% White
Johnson takes a big hit, but has no reason to worry. I tried to keep him as safe as possible in a primary, giving him as many of the same precincts in DeKalb County that I could. A portion of Gwinnett in here is pretty blue, but the rest is blood red Barrow, Walton, and Oconee Counties. Now that I think about it, the Black population could be lowered with some Black precincts given to one of the more marginal districts.
5th District: John Lewis (D)
Image may be NSFW.
Clik here to view.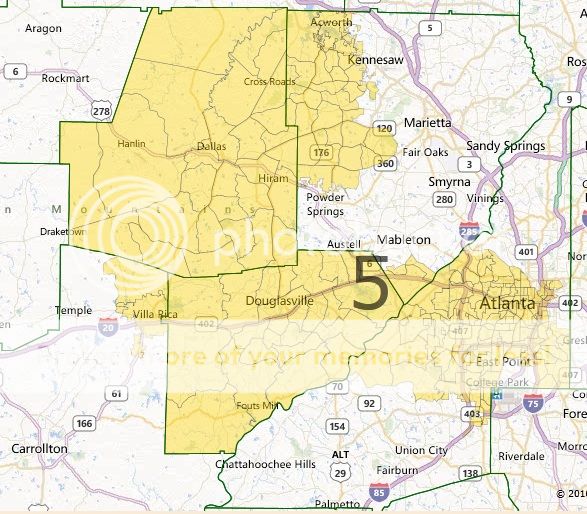
Image may be NSFW.
Clik here to view.
Statistics: D+9, 50% Black, 42% White
Lewis also takes a big hit. Paulding County is R+23, and his portion of Cobb County is similar. Douglas is Even now, though, and Atlanta should still be the biggest part of the primary electorate, which is all Lewis needs to worry about.
6th District: Tom Price (R)
Image may be NSFW.
Clik here to view.
Image may be NSFW.
Clik here to view.
Statistics: R+18, 71% White, 10% Asian, 9% Black, 8% Hispanic
Price loses the more rural parts of Cherokee County, as well as his few blue precincts on the South end of his district. In return, he gets a conservative arm into Gwinnett. It's still very compact for a vote sink.
7th District: Rob Woodall (R)
Image may be NSFW.
Clik here to view.
Image may be NSFW.
Clik here to view.
Statistics: D+4, 46% White, 22% Hispanic, 20% Black, 11% Asian
Woodall gets a basically unwinnable, majority-minority VAP district. This would be a good place for a statewide bid, as the representative would likely be somewhat moderate, especially since they'll have to survive minority dropoff in a midterm. It's also getting bluer by the cycle. Who would be a good candidate here, Georgians?
8th District: Austin Scott (R)
Image may be NSFW.
Clik here to view.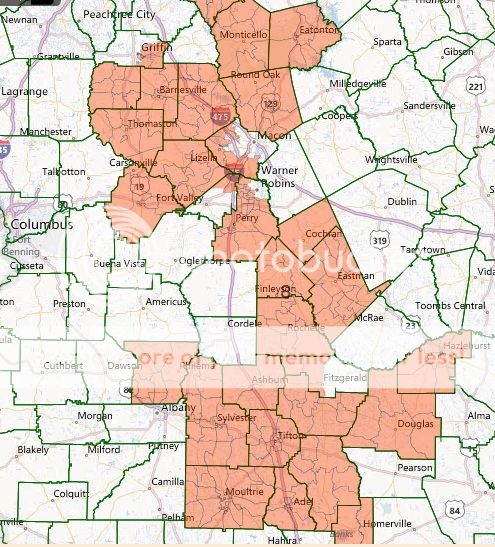
Image may be NSFW.
Clik here to view.
Statistics: R+21, 70% White, 23% Black
Jim Marshall's old district is completely conceded to the GOP. The district loses its only blue area, Macon and 2 rural Black counties, as well as Laurens which has some conservaDems. It grows outward on both sides in places but retains a similar shape.
9th District: Tom Graves (R)
Image may be NSFW.
Clik here to view.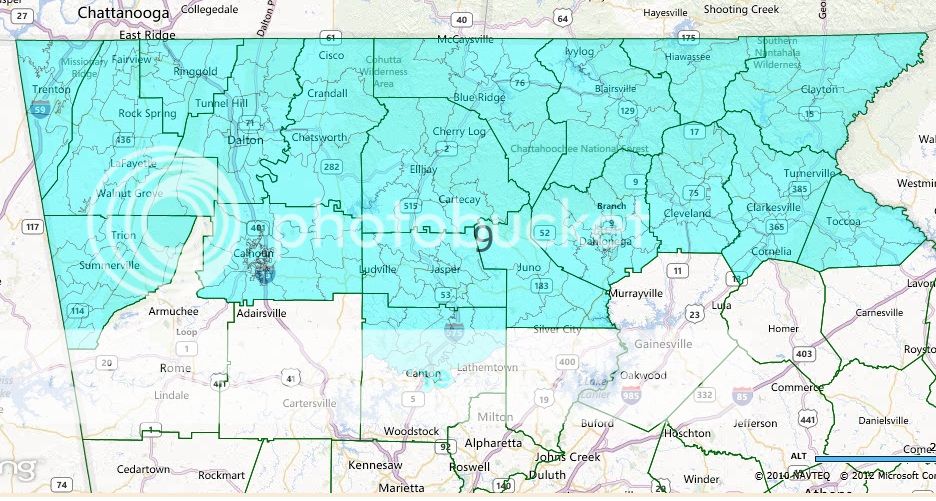
Image may be NSFW.
Clik here to view.
Statistics: R+29, 87% White, 8% Hispanic
Rural and as red as it gets in Appalachian North Georgia. The bluest county is R+22 Chatooga.
10th District: Paul Broun (R)
Image may be NSFW.
Clik here to view.
Image may be NSFW.
Clik here to view.
Statistics: D+5, 52% White, 41% Black
Seeing Paul Broun run in a D+5 district would be amusing; he'd have as much of a chance as Joe Walsh did this cycle. This district is (in my humble opinion) a masterpiece, creating a blue district by combining Athens, Macon, some of Augusta, and rural areas in between while leaving enough Democrats for Barrow to be safe as well.
11th District: Phil Gingrey (R)
Image may be NSFW.
Clik here to view.
Image may be NSFW.
Clik here to view.
Statistics: D+3, 58% White, 24% Black, 11% Hispanic
Gingrey should lose here, although not overwhelmingly. The district takes the central part of Fulton County, full of White liberals, as well as all the non-blood red parts of Cobb County to make a Lean Democratic district.
12th District: John Barrow (D)
Image may be NSFW.
Clik here to view.
Image may be NSFW.
Clik here to view.
Statistics: D+1, 54% White, 38% Black
Barrow's worries are once again more primary than general oriented. However, I kept conservaDem areas in to protect him (the places local Dems overperformed most in 2012): Montgomery, Wheeler, Telfair, and Laurens are all places Barrow could get over 45% in. A Black liberal primary challenger could lose a general but it'd still Tilt Democratic.
13th District: David Scott (D)
Image may be NSFW.
Clik here to view.
Image may be NSFW.
Clik here to view.
Statistics: D+9, 50% Black, 38% White
Not the most visually appealing because of Bishop's arm into Clayton County, but nonetheless effective in keeping much of Scott's base and keeping the district blue. R+19 Butts County won't be so happy though.
14th District: Doug Collins (R)
Image may be NSFW.
Clik here to view.
Statistics: R+28, 76% White, 10% Hispanic, 8% Black
Not the greatest looking district because it was a filler district, but it does the vote sink job very effectively.
And there you have it.
